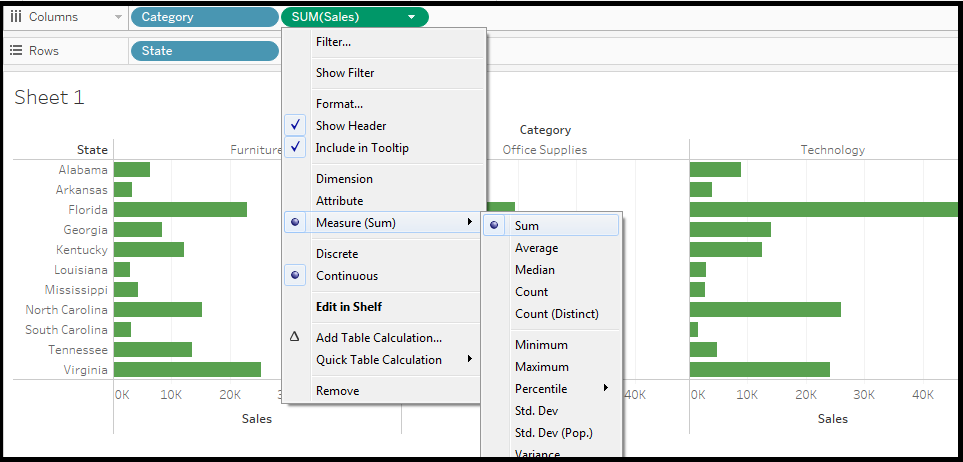
It is useful to look at numeric values using different aggregations function. Tableau supports many different aggregation types, such as:
Sum
Average
Count
Count Distinct
Median
Minimum
Maximum
Variance
Variance of Population
Standard Deviation
Standard Deviation of Population
Attribute
Dimension
In Tableau, you can create aggregation dimensions and measures. Whenever you add measures to your view, an aggregation is applied to those measures by default. The type of Aggregation used depends on the context of the view.
If you are not familiar with the database, then refer to Tableau manual for detailed definition of these aggregate types. You are adding fields into the visualization by default then it will be displayed.
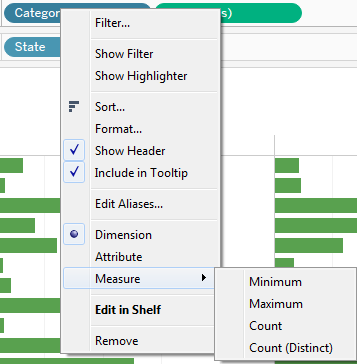
Tableau allows you to change or alter the aggregation level for a specific view. To change the default aggregation, do right click on that field inside the data shelf and change its default by selecting the menu options (default properties or Aggregation).
The data source used in the above figure is a data extract of an Excel spreadsheet. It is important to understand that if you depend on a direct connection to Excel, the median and count (distinct) aggregations would not be available. Access, Excel, and text files do not support these aggregate types. Tableau's extract engine do this task.
Aggregating Measures
When you add a measure to the view, Tableau automatically aggregates its value. Average, sum and median are the common aggregation functions.
The current Aggregation looks like part of the measure's name in the view.
For example:Sales becomes SUM (Sales), and every measure has a default aggregation, which is set by Tableau when you connect to a data source. You can change or view the default aggregation for measures.
You can aggregate a measure using Tableau only for relational data sources.
Multidimensional data sources contain data sources which are already aggregated.
In Tableau, the multidimensional data source is supported only in windows.
Set the default Aggregation for Measures
You can set the default aggregations for any measures. It is not a calculated field that itself contains an aggregate, such as AVG ([Discount]). A default aggregation is the preferred calculation for summarizing a discrete or continuous field. The default aggregation is used when you drag a measure to a view automatically.
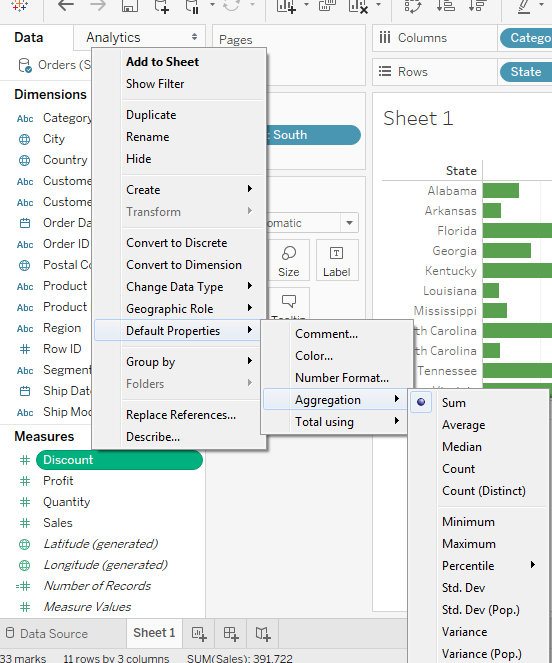
To change the default Aggregation
Right-click on a measure menu option in the Data field and select Default Properties then select Aggregation, and then select one of the aggregation options.
You cannot set default aggregation for the published data source. The default aggregation is set only when the data source is initially published.
How to Disaggregate the Data
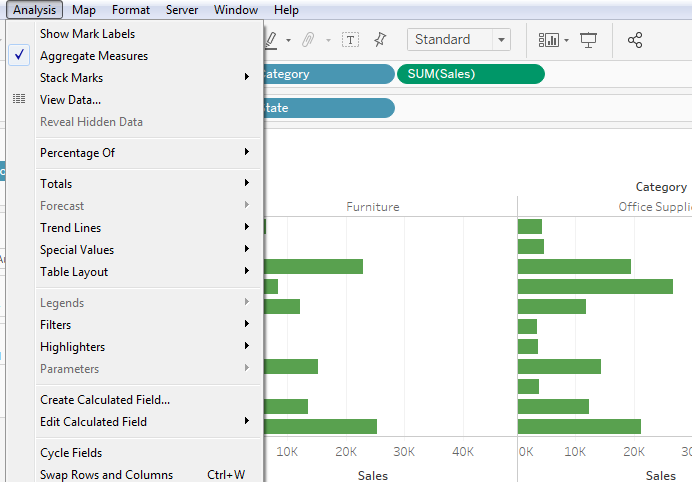
When you add a measure to your view, then Aggregation is applied to that measure automatically. This default is controlled by the Aggregate Measures setting in the Analysis menu.
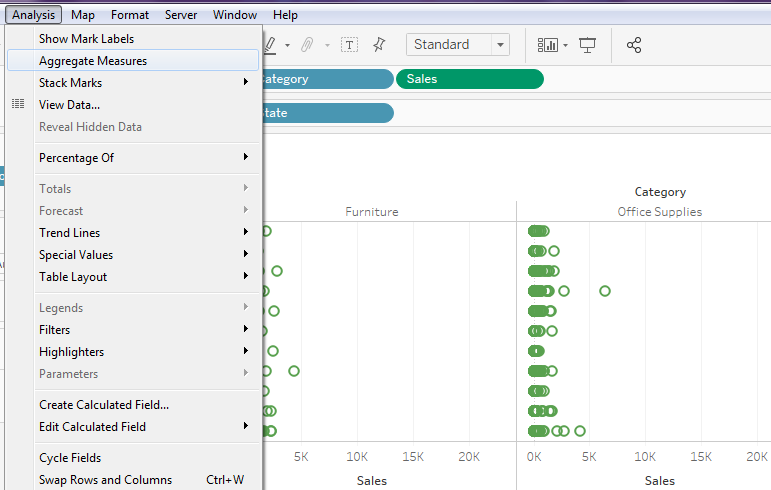
If you want to see all of the marks in the view at the most detailed level of the model, you can disaggregate the view. Disaggregating your data means that the Tableau will display a separate mark for every data value in every row of your data source.
Disaggregation in all Measures in the view
Click on the analysis then go to aggregation measures option. When Aggregate Measures is selected, then automatically Tableau will attempt to aggregate measures in the view. Means that it collects individual row values from your data source into a single value that is adjusted to the level of detail in your view.
The different aggregations available for measures determine how the individual values are collected: they can be averaged (AVG), added (SUM), or set to the minimum (MIN) or maximum (MAX) value from the individual row values.
If it is already selected, click aggregation measures once for deselecting it. Then, you can see the changes.
Disaggregating data can be useful for analyzing measures which you want to use both dependently and independently in the view.
Note: If your data source is very large, then, as a result, disaggregating the data can degrade in significant performance.
Aggregating Dimensions
You can aggregates dimension in the view as Maximum, Minimum, Count, and Count Distinct. When you aggregate a dimension, you have to create a new temporary measure column, so the dimension takes on the characteristics of a measure.
Note: The Count Distinct aggregation does not support the Text File and Microsoft Excel data sources using the inheritance connection. If you are connected to one of these types of data sources, then the Count Distinct aggregation is unavailable, and it shows the remark "Requires extract." If you save the data sources as an extract, you will be able to use the Count Distinct aggregation.
Another way to view a dimension as an attribute. You can change it by choosing the Attribute from the context menu for the dimension.
he attribute aggregation has several uses:
It ensures a consistent level of detail when blending multiple data sources.
It provides a way to aggregate the dimension when computing table calculations, which require an aggregate expression.
It improves query performance due to locally computed.
Tableau calculates the Attribute using the below given formula:
If MIN (dimension) = MAX (dimension) then MIN (dimension) else"*" end
This given formula is calculated in Tableau after the data is retrieved from the initial query.
The asterisk (*) is a visual indicator of a special type of Null value it occurs when there are multiple values.
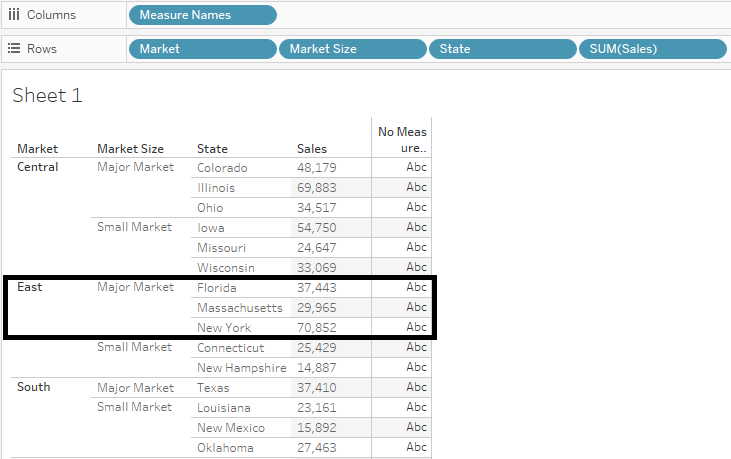
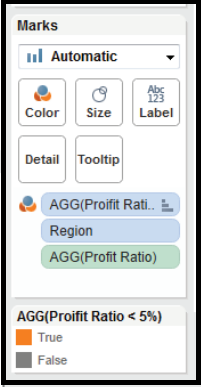
Above is an example of using Attribute in a table calculation. This table shows the market, market size, state, and sales by the market that is SUM (sales). Suppose, you want to compute the percent of the total sales according to each state contribution for the market. When you add some Percent of Total in table calculation that calculates along State, the calculation computes within the black area shown above figure just because the Market Size of dimension is partitioning the data.
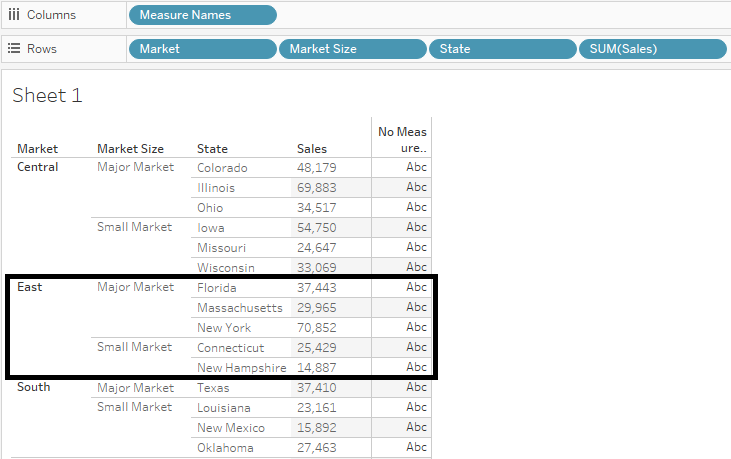
When you aggregate the Market Size as an Attribute, the calculation is computed within the Market (East), and the Market Size information is used as a label in the display.
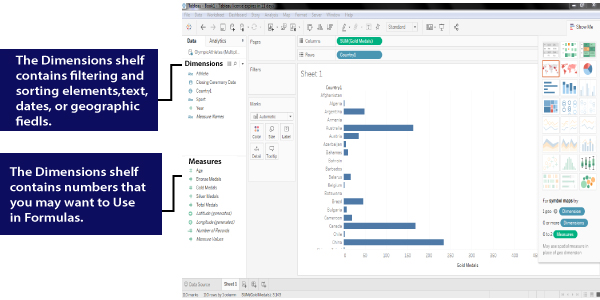
Data window is a way to show the connection between Tableau and data source. You can connect to as multiple different data sources in a single workbook. The small icons associated with data connections provide additional details about the nature of the connection.
Here, a workbook that shows the three different data connection given below:
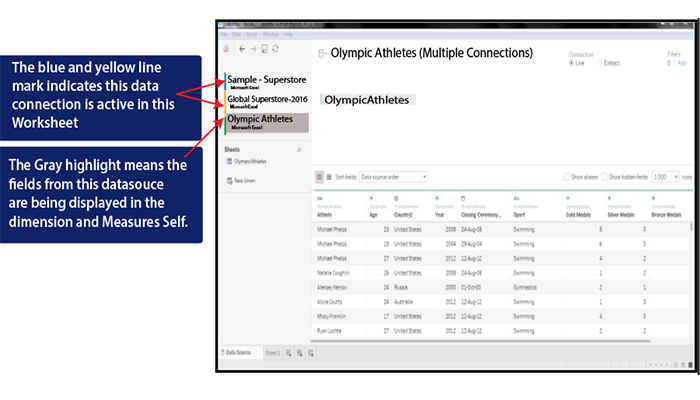
The green line next to the global superstore data connection indicates that it is the active connection in the worksheet. So, the bar chart in the spreadsheet was created using 'dimensions and measures' from that data source. Thus the bar chart is created using the dimensions and measures from the data source.
The Olympic Athletes data connection is a direct connection that is also indicated by the grey highlights. Those data source fields are currently displayed on the measures and dimensions shelves. The clipboard data source at the top of the data window was dragged and dropped into Tableau.
When you create data connections, Tableau will automatically evaluate the fields and place them on the measures and dimensions shelves.
Usually, Tableau placed most of the fields correctly. If something is incorrectly placed, drag the field to the correct location. Errors sometimes occur when numbers are used to illustrate dimensions.
For example, if you want to connect a spreadsheet that contains Olympic Athletes details and you want to know how many gold medals were won by different countries in last years, that field is placed into the measures shelf. Dragging gold medal field from the measures shelf and dropped into the worksheet would result in the field being summed. Properly placed on the dimension shelf, the athletes country would behave like a dimension and be expressed in a column or row. In the same way, the gold medal and country are represented in the above Figure.
Data Types in Tableau
Tableau expresses fields and assigns data types automatically. If the data source appoints the data type, Tableau will use that data type. If the data source doesn't individually assign a data type, Tableau will assign one. Tableau consist of the following data types:
Date values
Text values
Numerical values
Date and time values
Boolean values (True or False conditions )
Geographic values (longitude and latitude used for maps)
In the above figure, focus on the icons next to the fields in the measures and dimension shelves. These icons denote specific data types. A calendar with a clock is a date or time field. Numeric values have pound signs, and "abc" icons indicate text fields. Boolean fields have "True or False" values.
Tableau is a powerful data visualization tool; that's why Tableau has many unique terminologies and definitions. You should know their meaning before you start using these features in Tableau.
The most commonly used Tableau terminologies are listed below:
Alias: Alias is an alternative that you can assign to a dimension member, to a measurement part or a field.
Bin: Bin is a user-defined group of measures in the data source.
Bookmark: A .tbm document in the bookmarks folder in the Tableau repository that contains a single worksheet. It helps in improving data analysis. Unlike, web browser bookmarks, .tbm files are a compatible way to display various studies quickly.
Calculated field: Calculated field is a new field that the user creates derived files by using a formula to modify the existing fields in your data source. It is used to make your work simple and easy.
Crosstab: Crosstab is used for a text table view. It uses various text tables to display the numbers associated with dimension members.
Dashboard: The dashboard is a combination of several views that are arranged on a single page. In Tableau, dashboards are used to observe and compare a variety of data together, and also it allows interacting with other worksheets.
Data Pane: The data pane is on the left side of the workbook displays the fields of the data sources to which Tableau is connected. The fields are further divided into measures and dimensions. The data pane also reflects custom fields such as groups, binned fields, calculations, and many more. You can build views of your data by dragging fields from the data pane onto the various shelves, which is a part of every worksheet.
Data Source Page: Data Source is a page where you can set up your data source. This data source page generally consists of four main areas ? join area, left pane, a preview area, and metadata area.
Dimension: Dimension is commonly known as a field of categorical data. Dimensions hold discrete data such as members and hierarchies that cannot be aggregated. It also contains characteristic values such as dates, names, and geographical data. The dimensions used to reveal details of your information.
Extract: An extract is a saved subset of a data source which is used to improve performance and study offline. The users can create an extract by defining limits and filters that contain the data which you want in the extract.
Filters Shelf: Filter shelf is located on the left side of the workbook. Filters shelf is used to exclude the data from a view by filtering it using both dimensions and measures.
Format Pane: The Format pane is on the left side of the workbook, and it contains various formatting settings. It controls the entire view of the worksheet, as well as the individual fields in the view.
Level of Detail expression (LOD): The level of detail Expression is a syntax that supports the combination of various dimensions other than the view level. With the help of detail expressions, one can attach multiple dimensions with an aggregate expression.
Marks: Marks is a part of the view that visually represents one or more rows in a data source. It can be a line, square, or bar. You can control and alter the size, type, and color of marks.
Marks Card: Marks card is on the left side of the worksheet. The user can drag fields to the control mark properties such as color, type, shape, size, label, detail, and tooltip.
Pages Shelf: Page shelf is on the left side of the view. With the help of the page shelf, you can split a view into a sequence of pages based on the values and members in a continuous or discrete field. Adding a field with the pages shelf is similar to adding a field in rows shelf. For each new row, a new page is created.
Rows shelf: Row shelf is on the top of the workbook. It is used to create the rows of a data table. The Row shelf provides any numbers of measures and dimensions. When you placed a dimension on the Rows shelf, then Tableau creates headers for the members of that dimension. And when you place a measure on the Rows shelf, Tableau creates quantitative axes for that particular measure.
Shelves: The shelves are named areas that are located on the top and left of the view. You can build views by placing fields onto the shelves. Some shelves are only available when you select a particular mark type. For example, The Shape shelf is only open when you choose the specific Shape mark type.
Workbook: A workbook is a file with .twb extension that holds one or more worksheets as well as dashboards and stories.
Worksheet: The worksheet is a collection of sheets. It's a place where you build views of your data by dragging various fields onto the shelves.
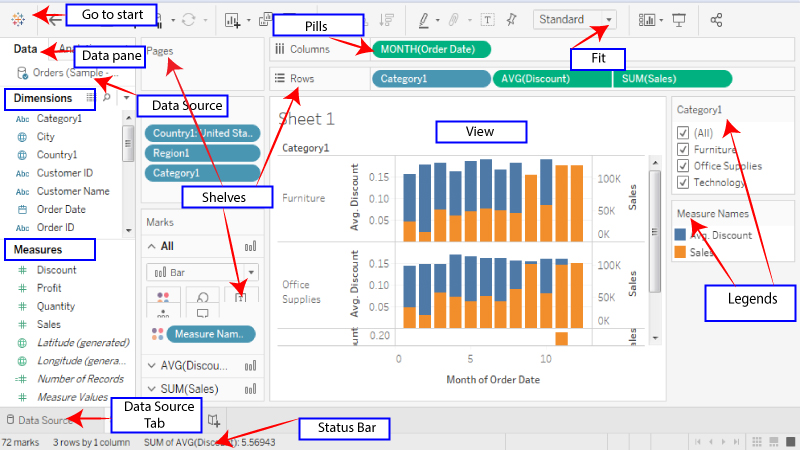
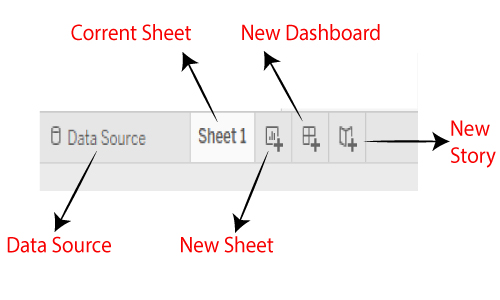
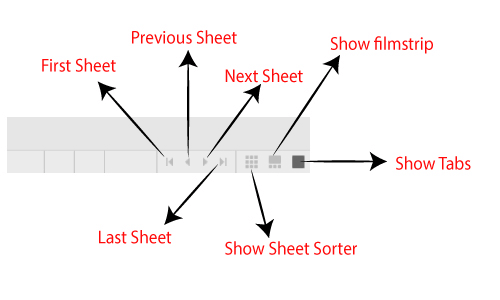
Tableau Navigations of the workbook can be explained using the below diagram:
Data Source: We can modify existing data source, and create or add the new data source using the 'Data source' tab, which is present at the bottom of the Tableau desktop window.
Current Sheet: Current Sheet is a sheet of workbook in which we are currently working. All the dashboards, worksheets, and storyboard present in the workbook, are available in this tab.
New Sheet: The new sheet icon presents in the tab is used to create a new worksheet in the Tableau workbook.
New Dashboard: The new dashboard icon presents in the tab is used to create a new dashboard in the Tableau workbook.
New Storyboard: The new storyboard icon presents in the tab is used to create a new storyboard in the Tableau Workbook.
First Sheet: This first sheet icon presents in the tab at the bottom of the right-hand side of Tableau desktop window is used for visiting the first sheet directly.
Previous Sheet: The previous sheet icon is used to return back to the last worksheet from the new sheet.
Next Sheet: The next sheet icon is used to jump to the next worksheet of Tableau desktop.
Last Sheet: The last sheet icon is used to visit the final sheet of tableau workbook.
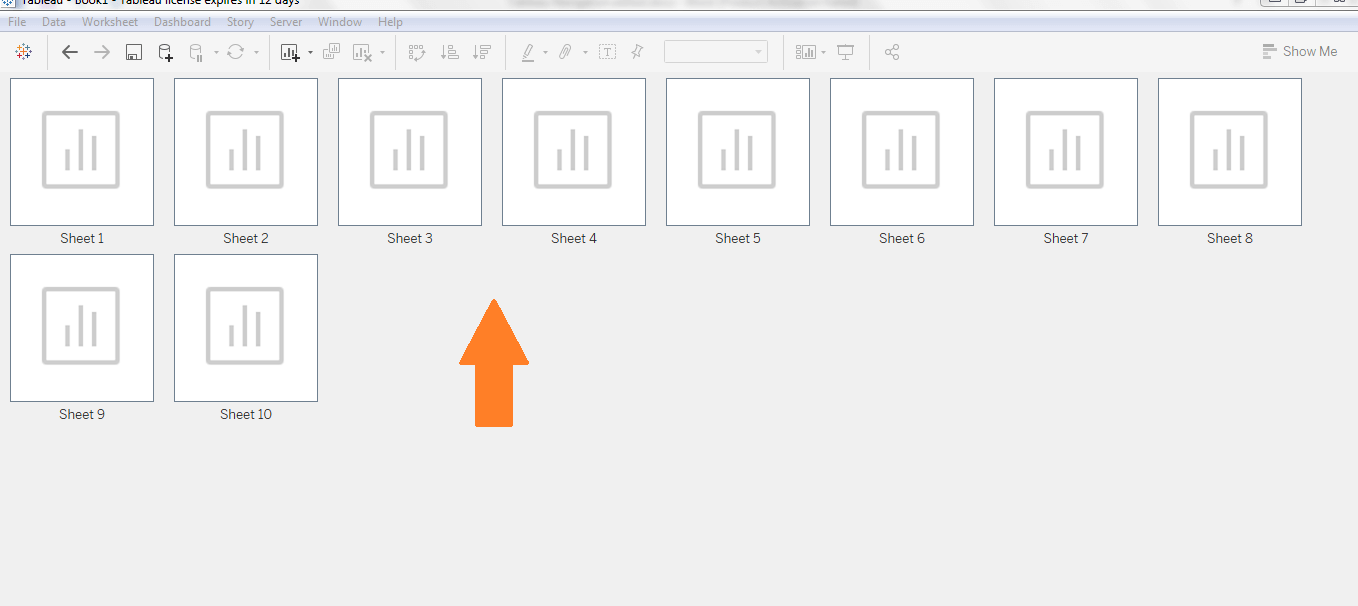
Show Sheet Sorter: You can view all the created worksheet in tableau desktop by clicking on the show sheet sorter icon.
Show Filmstrip: All the tabs are shown here with their icons by clicking on the show filmstrip.
Show Tabs: This tab concludes all tabs such as worksheets, data sources, dashboards, and storyboard.
Instead of call "Log a Call", we need to name it "Log an Activity"
Add a custom field in the "Log an Activity" panel called "Area"
Add "Area" field in the Activity logged panel
Add custom field
From Object Manager, you will not see the New field button in the Task object, but go to the Activity object, then you will see the New button in Fields & Relationship.
Create the custom field here, you may choose to add the field to Event and Task layouts.
Create "Log an Activity" action
From the Setup menu, go to Global Actions, then click the New Action button, select and enter the data then click the Save button.
You will see a layout to add/remove fields for the new action, let us add "Area" here, click the Save button once done.
Add "Log an Activity" action to Activity component
Let us add the "Log an Activity" action (and remove the "Log a Call" action if exist) from Contact. Go Contact object from Object Manager, open a page layout (make sure this is the correct page layout). Look for the "Salesforce Mobile and Lightning Experience Actions" section, if you see the message "Actions in this section are predefined by Salesforce", click the "override the predefined actions" link.
Click "Mobile & Lightning Actions" at the top panel then drag the "Log an Activity" action to the "Salesforce Mobile and Lightning Experience Actions" section, also remove the "Log a Call" action if exist. Click the Save button when done.
Now you should see the "Log an Activity" tab (with Area field) under Activity in Contact.
Once the activity saved, it will show as a closed task, but Area is not added yet.
Add "Area" field in the Activity logged panel Navigate to Task object from object manager, click Compact Layouts tab, then New (or edit existing compact layout), add Area field, I also add a few more fields such as Status, Created By.
Click the "Compact Layout Assignment" button to assign the newly created layout as the primary compact layout.
The "Subject" will appear on the top (next to the icon) and the "Description" field will be shown by default. If you go to Account, you will see the same task too, because, by default, activities from Contact will roll-up to Account. However, there is a small difference here, instead of showing "you logged a call about" account name, here you will see the task with "you logged a call with" contact name.
Salesforce Lightning: Log a Call button does not appear in Activity component
For those of you who have been migrated from Classic to Lightning, you notice that "Open Activities" and "Activity History" are no longer appeared in the related list, instead, they appear as a Lightning component called Activity. Log a Call, New Task, and New Event will not show as buttons anymore, but as tabs under the Activity component, as they appear as a separate component, users can enter the data without leaving the main detail page.
However, if you don't see those tabs under the Activity component, here are a few things you should check:
1. Page Layout
Yes, I am referring to the Classic page layout, not Lightning Page. If you have multiple page layout based on profile or record type or both. Make sure you are checking the correct page layout.
Open a record, click the gear icon, then Edit Page link, click Details tab, then click the layout in Details tab, check the page layout name with (previewed).
Now, go to that page layout -- back to the record page, click the Edit Object link under the gear icon, select the Page Layouts menu, then click the same page layout showed in the previewed earlier.
Make sure Log a Call, New Task, and New Event are added into the Salesforce Mobile and Lightning Experience Actions section.
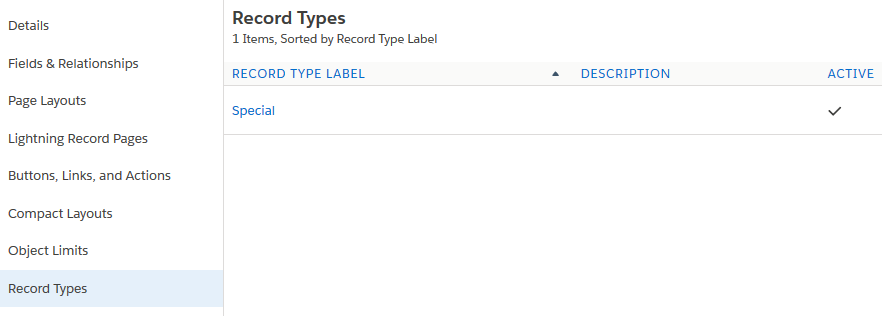
2. Record Type
Check if you have record type defined (even only one) in Task and Event, make sure they are selected in the global action because "one action only for one record type".
Now go to Global Actions under the Setup menu, click edit on Log a Call action. In the Record Type, change --Master-- to Special, and click the Save button.
Now, back to the record page and check the Activity component, you should see the Log a Call action appear under the Activity component. The same for the New Task action, it should appear too once you fix the Global Action.
For New Event action (as it is Event object), check if you have Record Type defined in the Event, if yes, you need to do the same for New Event action to define the Record Type.
When Enhanced Email is enabled, Salesforce will create EmailMessage object. Emails sent from Salesforce are saved as Email Message records and Task records. There is a link from the Email Message record to a Task record, which is ActivityId field.
If you use the Outlook panel (and without enabling EAC), you can "Log Email" manually to Salesforce for email received and sent out. Both emails received and sent will be stored both as EmailMessage (prefix 02s)record and Task record (prefix 00T).
How to differentiate emails sent from Salesforce and manually logged from an email client?
You will not find any difference on the Task object, both Type and TaskSubType will populate with "Email". But there are some differences in the Email Message object. Check out this query: SELECT Id, ActivityId, FromAddress, ToAddress, FromName, IsClientManaged, MessageIdentifier, Subject, TextBody FROM EmailMessage
Row 1,4,5 - email manual log from Outlook
Row 2,3 - email sent from Salesforce
As you can see, IsClientManaged and MessageIdentifier are different.
Note: using the legacy My Email to Salesforce service (BCC) will not create Email Message records, but only Task.
Email in Lightning activity component
All emails logged to Contact or Lead will be shown in the Lightning under the activity component.
For emails manually logged and sent from Salesforce, clicking the email will open the EmailMessage record, and you will be able to Reply All, Reply, or Forward the email from that panel. Hover mouse over the email will show the URL where it will be landed, for example, https://mydomain.lightning.force.com/lightning/r/02s2H00001BMfIgQAL/view
For email from BCC email services, clicking the email will open a Task record, there is no option to reply, reply all, or forward as the record is a task. Hover mouse over the email will show the URL where it will be landed, for example, https://mydomain.lightning.force.com/lightning/r/00T2H00007KIQvsUAH/view
For EAC email, clicking the email will open the email in that panel, you are also able to Reply All, Reply, or Forward the email from that panel. The system also shows if the email is shared with everyone or a group or not shared. Hovering the mouse over the email will not show any URL, click "View full email" will open the full email as an email stream.
In Salesforce.com, for Activity objects (Task & Event), there is only 2 options in the Organization-Wide Defaults sharing setting:
- Controlled by Parent
- Private
Private
Only the activity owner (label as Assigned To), and users above the activity owner in the role hierarchy can edit and delete the activity.
Users with Read access to the record to which the activity is associated (Name and Related To) can view and report on the activity.
Controlled by Parent
A user can perform an action (such as view, edit, transfer, and delete) on an activity based on whether he or she can perform that same action on the records associated with the activity.
For example, if a task is associated with the Acme account and John Smith contact, then a user can only edit that task if the user can edit the Acme account and the John Smith contact.
The "parent" of the activity record is:
Who Id (Name): Contact and Lead
What Id (Related to): Account, Opportunity, Case, Campaign, Asset, and custom objects with Allow Activities enabled.
To edit a task, the user needs to have Edit Tasks permission defined in the Profile or Permission Sets and to edit an event, the user needs to have Edit Events permission defined in the Profile or Permission Sets. Both permissions are located under General User Permissions in the profile, or this permission also can be assigned to specific users using the Permission Set.
When a user creates a task/event, regardless of the parent of the task/event owner, the default task/event will be assigned to the current user, not based on parent record owner.
When the user is assigned to a task/event, the user is able to access and edit the task/event (the user need to have Edit Tasks/Edit Events permission to edit task/event), regardless of the OWD sharing setting for Activity, and even user does not have access to the parent record of that Activity record. This edit access will include users in the higher role hierarchy of the assigned user.
Permissions related to View an activity:
Be assigned to the activity, or
Be above the user assigned to the activity in the role hierarchy, or
Have at least read access to the record to which the activity is associated, or
Have the “View All” object-level permission in the related record, or
Have the “View All Data” permission
Create an activity:
Have the “Edit Tasks” and “Edit Events” permissions; AND
Have at least read access to a record, if associating the activity with another record
Edit or Delete an activity:
Have the “Edit Tasks” and “Edit Events” permissions; AND
Be assigned to the activity, or
Be above the user assigned to the activity in the role hierarchy, or
Have the “Modify All” object-level permission in the related record, or
Have the “Modify All Data” permission
View, add and edit events on other users’ calendars
Have the “Edit Tasks” and “Edit Events” permissions to create and edit activities AND
Have access to the user’s calendar, which depends on your organization-wide calendar sharing defaults and how the user has set up individual calendar sharing.
Note:
Events marked as private via the Private checkbox are accessible only by the user assigned to the event. Other users cannot see the event details when viewing that user’s calendar.
However, users with the “View All Data” or “Modify All Data” permission can see private event details in reports and searches, or when viewing other users’ calendars.
Tip:
The user who is assigned to an activity in the Assigned To field is often referred to as the “activity owner”.
Lightning App Builder offers admin to add/remove items easily in Navigation Items. The items added will be shown as default items in the navigation bar, which also means the user will not able to remove the items added to the Navigation Items, the cross icon simply will appear when clicking the pencil icon at far right on the navigation bar.
Let us create a new app with 4 items:
This is how it looks like
When you click the pencil icon at the far right of the navigation bar
Items manually added by the user will have the cross icon to remove them.
What happened when the admin remove the existing items?
Will the item removed stay or remove for existing users? The answer is both, it can be stayed or removed, but here is the guidance
The items will stay if there is personalization done by the user. What does personalization here mean?
Add new tabs
Re-order existing tabs
However, even the tab stays, the user will be able to remove those items now.
In this scenario, the user re-orders Contacts after the Accounts tab
The items will be removed if there is nopersonalization done by that particular user, even that user actively used the tabs in the past.
How do I know if a user has personalized the tab?
If the user clicks the pencil icon, notice on "Reset Navigation to Default", if this is clickable (blue color), this means the menu has been personalized. But if "Reset Navigation to Default" is not clickable (gray color), this means the user has not personalized their menu.
How about adding new tabs?
Adding new tabs will always be added to all users who use the Lightning app, no matter if they have or have not personalized their navigation menu.
A tab of an object is very useful and increases user daily productivity with fewer clicks, the tab will be visible in an app based on multiple settings, let's dive into it.
First, for a user to able to see the tab, the user must have access to the object via Profile or Permission Set.
Default tab -- this mean, the tab will be always visible to the user, and users can't remove it from the Lightning app, the user will not see the cross icon when clicking the pencil icon from the navigation bar.
Users will not able to remove the Home tabs until the Chatter tabs
The criteria to make a tab become a default tab:
The user must have permission to access the object via Profile or Permission Set, and
The tab is added to the Navigation Items for the app in the Lightning App Builder, and
The tab is set to Default On in the Profile, or "Visible" is checked from Permission Set
If (2) or (3) is changed, the tab will be removed if a user has not customized the navigation items, but if the user has customized (rearrange) the navigation items, the tab will stay, but the user will be able to remove the tab by clicking the pencil icon from the navigation bar, see this blog for detail.
Not default tab -- the example from the above screenshot is "Glass", where the tab is removable. To make this happen, here are the requirements:
The user must have permission to access the object via Profile or Permission Set
The tab is set to Default Off in the Profile, or only "Available" is checked in the Permission Set, no matter whether it is added or not in the lightning app Navigation Items.
The user should be able to search the tab from the 9-dots icon.
Activity in Salesforce is represented by Task and Event objects, they are special objects with a few limitations compared to other standard and custom objects, one of them being field tracking.
Before the Spring '23 release, you can't track field changes in the Activity, with community members creating and voting this in IdeaExchange that earned 33000+ votes.
The spring '23 release allows us to track activities fields history, with some limitations, but it is definitely a good starting.
Navigate to the Task or Event object and click the "Set History Tracking" button and select up to 6 fields.
You can add the Activity Record History component from Lightning App Builder.
Here is the sample result in a Task:
Unfortunately, I don't see this yet in reporting, hope this will come in coming releases, or let me know if you see this. But you can query with API to object ActivityFieldHistory.
I have no idea why the Ids are 000000000000000AAA, hope will see some explanation in the future.
For more information, looks for Event and Task History Considerations in this article Field History Tracking (as per Spring 23 release):
It can take up to a few minutes for changes to appear in history.
You can track up to six fields on events or tasks.
After an activity is deleted, the history for the activities can be visible via API queries for up to a few days. The history remains available because it’s deleted asynchronously from the activity.
Not all changes to recurring and child events are tracked.
You can’t delete specific field history records.
Bulk processes such as Bulk API transactions or event syncing can be delayed when field history tracking is enabled. If processes are delayed, consider turning off activity field history tracking.
The parent record of an activity is locked when the activity history updates. For example, if an activity is linked to thousands of accounts, each account is locked while the history updates. As a best practice, avoid data skew. If processes fail because of parent-child row locking, consider turning off activity field history tracking.
Field value changes caused by process builder, Apex triggers, or flows are tracked in an activity’s history. Users see the change only if their field-level security settings permit them to. In other objects, field changes from processes, triggers, and flows are tracked only if the current user has permission to edit the modified fields.
If a previously encrypted field used for tracking is unencrypted, the values tracked while the field was encrypted don’t appear. After the field is unencrypted, the values are tracked in history.
Activity history is available in APIs only for admins with permission to modify all data.
For activities, field history is shown in a Lightning component that looks like a related list. Instead of managing the history on the page layout, you place the Activity Record History component on Lightning pages for event and task records. You can add the Activity Record History component to custom event and task pages or remove it from the default pages. The history list stays empty until you turn on field history tracking in the Object Manager.
The history list isn’t available in Salesforce Classic or in the mobile app.
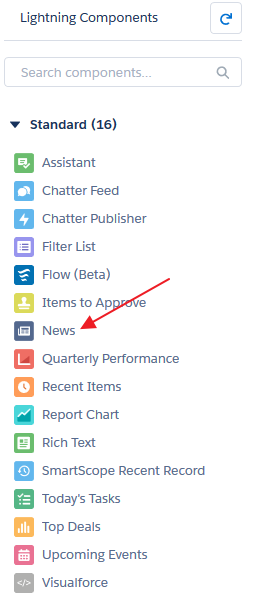
Salesforce Lightning: News in Lightning Components
I thought News component is standard and available to use in Lightning App Builder, but when I edit Home page, I see the News component is not there, the screenshot below taken from "Home" page, the same experience when I go to Account, Contact, Lead, and Opportunity lightning app builder page, I can't find the News component too.
As per this Salesforce article The News Component, News component is available from Group to Unlimited Editions, but why it is not available?
Root cause: this is because News have not enabled for that org. Follow this steps to enable it:
- Navigate to Setup | Feature Settings| Sales | Account Settings
- Tick Enable News
- Click Save
Now, back to Lightning App Builder for Home page, and notice the News component are now available to use, the same when I edit Account, Contact, Lead, and Opportunity lightning app builder page.
Let's see what is offered by News component and where it exists. This component will get instant access to relevant, timely news about customers, partners, and competitors. The News component includes articles and Twitter posts, and is available on Accounts, Contacts, Leads, Opportunities, and the Home page. It provides relevant, timely news items that help you stay up-to-date with the companies, people, and industries you work with. News is available from US news sources in English.
HubSpot Vs Salesforce – Which CRM Is BEST For You?
Read this Article with an In-depth Review of the top CRMs HubSpot Vs Salesforce & Detailed Feature-wise Comparison to Select the Best Option:
Salesforce offers enterprise-level CRM capabilities and has many competitors from the technology giants like SAP, Adobe, Microsoft, and Oracle. Salesforce is not the only CRM in the market.
In 2014 HubSpot offered a free SaaS CRM product. Yes, all free. Salesforce is nowhere close to offering anything near to this.
HubSpot Vs Salesforce Market Size
Salesforce occupies the #1 spot in the Customer Relationship Management (CRM) space. As per Forbes, Salesforce had a 19.5% CRM market share in 2018. HubSpot had a market share of 0.44%.
HubSpot may not have the grand scale of Salesforce CRM, but it does have a humble pie of 0.45% of the market. It is quite heartening to realize that HubSpot is striding forward at an exponential rate.
With the increasing popularity of HubSpot, it is imperative to compare the two CRM products as you must be pondering whether to adopt Salesforce or HubSpot for your business?
In this post, we provide insights on who will fare better as a CRM – HubSpot or Salesforce?
Important data on the two CRMs:
As per Statista, Salesforce has reached a revenue of $13.28 billion in 2019 and this amounts to a ten-fold increase to what it was ten years back.
HubSpot offers a free CRM at its core with a full stack of software for marketing, sales and customer service.
For HubSpot, 6800 companies across 100 countries are growing their business with HubSpot.
As you compare between HubSpot vs Salesforce, it is better to opt for the CRM that acts in the best interest of your business. There is no one-size-fits-all solution so it becomes essential to choose the features, suitable for your business.
Comparison Of The CRMs: Salesforce Vs HubSpot
Here is a table on the comparison between Salesforce and HubSpot:
CRM
Salesforce
HubSpot
Applies Best For
Salesforce works on a multi-tenant model which serves companies of all sizes.
It is a CRM meant for small and medium businesses which does not require complex CRMs.
Ease of Use
Salesforce fares well in ease of use. (Score: 3.9/5). It creates custom tabs based on standard and custom objects.
But HubSpot fares better. (Score : 4.4/5)
Customer Support
Salesforce comes with a good customer support.
HubSpot comes with a better customer support.
Pricing Model
Salesforce comes at a monthly payment and annual subscription.
HubSpot is a free software.
Pricing
Starts from $25.
It is free.
Ease of Setup
Salesforce Essential for small businesses offers quick and in-app support.
HubSpot fares better in terms of ease of setup with a free basic version.
Sales and Pipeline Management
Salesforce is a CRM which was built with sales growth in mind. Salesforce connects with a whole new way. It has its own Artificial Intelligence platform called Einstein.
Salesforce offers customization of deal stages as per the sales process. It offers personalized reporting too.
HubSpot comes with sales tools lesser in scope and offers unlimited email scheduling as an exception.
HubSpot comes with seven pre-configured stages for pipeline management. Only one pipeline is allowed for a single organization and one sales process for one product.
Marketing
It offers a robust Marketing Cloud product.
The Marketing team passes leads to the sales team with the marketing and automation tools.
It offers seamless experience across all customer touchpoints
In HubSpot, truly personalized messages for any audience is done by marketing automation.
The marketing tools of the likes of collected forms, lead flows and lead analytics create lead pipeline and move the leads towards the sales team.
Implementation
Salesforce offers a paid plan but after a 14-day trial period. Salesforce needs some external help such as inhouse expert or some other specialist.
HubSpot is a free CRM and can run in a few minutes. It allows to import all contacts as CSV.
Training
Salesforce offers content in the form of its e-learning hub called Trailhead.
HubSpot is way ahead of Salesforce in terms of free content resources and has its own, comprehensive HubSpot Academy
Integration
Salesforce offers internationally supported integrations with SAP, Google Cloud, Intuit Quick books, etc.
HubSpot offers an integration library with 270 out-of-the-box integrations. It integrates with apps like Slack, Jira and Mail Chimp, etc.
Analytics and Reporting
Salesforce incorporates powerful analytics and reports. The Einstein Analytics dashboard in Salesforce monitors key business metrics based on key dimensions like products, region and time period.
HubSpot comes with built-in analytics, reports and dashboard for smarter data-driven marketing. But due to limited data storage, HubSpot analytics is limited too.
Features
Salesforce comes with following features but not HubSpot:
Internal Chat Integration
Mobile Access
Social Media integrations
Quotes/Proposals
Territory Management
HubSpot Offers Marketing Automation Integration but does not come with social media integration.
Note: The measurement is totally subjective since the review on Salesforce is based on a higher number of reviews.
Feature-wise Comparison Of Salesforce Vs HubSpot
We have chosen some parameters to differentiate between the two CRMs.
These are:
User Interface and Set up
Ease of Use
Pricing
Sales and Pipeline Management
Marketing
Analytics and Reporting
Implementation and Support
Integration
The detailed comparison of the two CRMs for the features listed above:
#1) User Interface And Set up
The main purpose of any CRM is the facilitation and management of any or all of the client-centric data. In HubSpot, you can import files to create or update contacts, deals, companies or products.
On the other hand, in Salesforce we have objects, standard, and custom that includes contacts, leads, accounts, opportunity, and others.
Your sales team will always yearn for deals in the pipeline and the contacts to get connected when it is time to close the deals. Both the CRMs streamlines these kinds of data. Ease of use is also a critical aspect to consider.
See the screenshot of the dashboards for Salesforce below:
Both the CRMs have a structure with a top menu bar that allows the user to navigate easily to the various objects such as contacts, leads, accounts, deals, reports and many more. However, the HubSpot Software rates better in terms of ease of use and ease of set up when compared with Salesforce.
We know that Salesforce CRM has standard and custom objects. It creates custom tabs say on files, tasks, engagements, etc. on its custom objects.
The below image explains how a custom tab is created on an Engagement object:
Custom tabs provide the user with unique user experience. A Salesforce user gets an Account Manager and an implementation expert for optimized user experience – to meet the client requirements.
On the other hand, HubSpot provides a free basic version that is set up within a short time. However, Salesforce Essential for small business also offers quick set up and in-app support.
Salesforce fares well in ease of use with a score of 3.9/5. It creates custom tabs based on standard and custom objects. But, HubSpot fares better than Salesforce and has a score of 4.4/5.
Hubspot is suitable for small and medium-sized businesses with 10-200 employees that do not need advance features of a complex CRM. While Salesforce can serve businesses of all sizes. It offers advance features such as a multi-tenant cloud computing model.
#3) Pricing
Salesforce is a CRM suitable for larger enterprises – ready to invest in feature-rich CRMs. HubSpot serves smaller businesses. Salesforce CRM has a price whereas HubSpot comes absolutely free.
Let us compare the pricing for Salesforce with HubSpot.
(i) Salesforce Price
Salesforce pricing gets offered based on various clouds. Let us find some details on the sales cloud, marketing cloud, service, and commerce cloud. The price depends on the number of users and on a monthly basis.
It comes to $25 per user per month and goes over $300. The monthly fees are dependent on the needs and scale of each business.
Here are the prices of Salesforce for Sales Cloud based on various editions of the software:
Moreover, Salesforce extends capabilities with addons as explained in the below screenshot:
Next, we come to HubSpot price.
(ii) HubSpot Price
The HubSpot software comes in three forms as follows:
The HubSpot software for Marketing Hub starts from free and goes up to $800/month.
The Sales hub starts at zero for a single salesperson and goes up to $800/month for the entire team.
Please explore this link for further information on prices for Sales and Service Hub.
#4) Sales And Pipeline Management
Sales are the most critical function of modern-day business. Salesforce transforms your sales from lead to cash. The sales process often exists in silos- order management, marketing automation, etc.
(i) Salesforce
It was built as a CRM to drive sales growth. So, most organizations start using CRM for building their sales team. The software comes with built-in leads, contacts and other tools.
It allows the SMBs to use Sales Cloud Lightning Essential Plans for custom contact, lead flows and account management.
The below image shows the opportunity object with the sales stages:
Salesforce unifies the entire sales process and connects with the customer in a whole new way. It also introduced Einstein – its own Artificial Intelligence (AI) platform. The Sales Cloud offers add-ons to enable you to encash on Einstein tools or Pardot B2B marketing automation.
Salesforce carries the following activities:
Work smarter with Einstein
Work faster with Lightning
Sell as per Expectations
a) Work smarter with Einstein:Here, Amazon web services come into the picture. Salesforce predicts customer behavior in a proactive way. It helps the sales reps to build a meaningful dialog with the customer. Salesforce acts as an enabler at scale.
Predictive Lead Scoring empowers the sales reps to prioritize the best leads. It finds which leads have the propensity to move forward. It operates at the deal level, where to pull back – trends down and up. Salesforce makes faster decisions with Actionable Analytics. Wave collects metrics in one place and takes immediate action. It impacts B2B marketing for aligning with marketing for improved campaign ROI.
b) Work faster with Lightning:Lightning takes Salesforce to a new level. Lightning Invoice helps reps not to forget about customer conversation. It allows the reps to work from anywhere. Salesforce1 and other mobile applications help the reps to sell the way they like to.
c) Sell as per Expectations: App Builder streamlines the flow and redesigns the experience. The reps get faster quotes and orders. Lightning Bolt provides templates and blueprints with UI. It builds an ecosystem of apps. Salesforce is easy to customize.
(ii) HubSpot
On the other hand, HubSpot comes with sales tools but with lesser scope – with the exception of unlimited email scheduling. It offers a single schedule meeting link – for just one rep for the free version. You can embed the link on the website for the visitors to schedule meetings. It saves time at every stage of the funnel.
The following activities are done by HubSpot:
Automate Outreach without being Impersonal
Create/Share Email Templates
Follow-up without flaws
More Meeting
Make Deals
Track your entire pipeline.
Salesforce offers customization of deal stages as per your sales process. It creates personalized reporting too. You can add this at a later stage of the pipeline.
HubSpot comes with seven pre-configured stages for pipeline management. Only one pipeline is allowed for a single organization and one sales process for one product.
Pipeline management in Salesforce:
Pipeline Management in HubSpot is not at all a match with what is offered in Salesforce. Tasks for each deal stage, automated tasks for deals moving forward and unlimited products/deal. HubSpot automates only certain tasks and cannot integrate applications like inventory, accounting into the system.
Sales dashboard to track the progress and health of your sales pipeline:
#5) Marketing
(i) Salesforce
Salesforce offers a robust Marketing Cloud product. It comes in bundles with a wide range of features and pricing.
The Marketing team passes leads to the sales team with the marketing and automation tools. The tools create a seamless experience across all customer touchpoints.
If you want further details on the tools, say Mobile Studio, Social Studio, etc please refer to the link.
Salesforce offers personalized services for building loyalty and relationship with customers. It makes customer interactions as the reason for which you earn the admiration of the client.
It helps marketing in the following ways:
Put Customers at Centre of Interactions: Salesforce enables to put the customers at the center of every interaction. It reconciles data both from known and unknown individuals. It connects data sources across channels and devices.
Automate Customer Engagement: It builds connected journeys based on customer actions, right at that moment. You can plan and optimize every interaction with AI. It uses cross-channel data for building new segments.
Build Marketing Strategy Around Customer Journey: It engages across all touchpoints and connects with customers at the right time with the right message. It tracks and analyses the results to optimize every experience all over the customer lifecycle.
Please watch the video for further details on the impact of Salesforce on Marketing.
(ii) HubSpot
In the case of HubSpot, you can truly personalize your messages for any audience. And all this is done by using marketing automation for nurturing your audience. It comes with marketing tools of the likes of collected forms, lead flows, and lead analytics.
The tools create a lead pipeline and move the leads towards the sales team. Since HubSpot was first a marketing automation tools so it offers easy to use and powerful capabilities. It is meant for the SMBs.
HubSpot helps marketing in the following ways:
Personalize Marketing: It allows automation of email campaigns as in Salesforce but goes beyond that in the form of social automation for automatically sharing every blog post – across all channels. Marketing Automation in HubSpot streamlines ads audience creation to contact segmentation.
Optimize for Conversion: Marketing Hub in Salesforce has all the tools to establish your authority. It has a content strategy tool unlike Salesforce for structuring the site for organic reach. It integrates with Google Search Console for creating a tactical plan for improving your ranking. It can run A/B tests on the landing page, site page or email.
Measure ROI: Measure the ROI with the creation of great content. It enables to understand the pages, channels, and campaigns for driving traffic and conversions. You can easily attribute contacts, deals, and revenue to marketing efforts with campaign reporting as well as create a custom report across a set of data points.
Salesforce incorporates analytics in all of its tools. Contacts and account settings are all customized with custom objects. The Einstein Analytics dashboard in Salesforce monitors key business metrics based on key dimensions like products, region and time period.
It uses interactive charts for easy-to-read format. You can add tables for record-level details and filters for change in focus. It helps to increase the overall efficiency of the business analytics by easy visualization of data at a glance.
It has a web analytics dashboard that quantifies the information on the web presence of the organization. The analytics dashboard provides real-time reporting in a digestible manner.
The activities performed by Salesforce analytics are:
Visualize Data for enhanced understanding
Customized Dashboards as per needs
Reporting, analyzing and real-time presentation of data
HubSpot comes with built-in analytics, reports, and dashboard for smarter data-driven marketing. But due to limited data storage of HubSpot, the analytics is limited too.
Here are the reports:
a) Track Complete Customer Lifecycle
Track the entire journey from a visitor to a loyal customer. It discovers trends for data over time. Generates a report based on contact, company-level details. It uses multi-touch revenue attribution to close the loop of marketing efforts.
Tracking customer lifecycle:
b) Analyze Site Performance with Key Website Metrics
HubSpot also has a web-analytics dashboard with a set of metrics for website effectiveness. Some of these metrics are time-on-site, bounce rate, new vs returning visitors, etc. This is how a web-analytics dashboard looks like in HubSpot.
Website metrics:
Some of the reports available with this web-based dashboard are:
c) Detail Reports on each of the Marketing Channels
Generate detailed reports on all your marketing assets – emails, landing pages, social media, etc. Track the critical metrics in one place and share insights with your team.
It offers a paid plan but after a 14-day trial period. With Salesforce, you always need some external help such as inhouse experts or some other specialist.
The Salesforce plans all come with a standard support package and comes with a 2-day response window for your queries. If you require to reach your goals faster, then you must shell out extra money with a premier or premier plus plan.
These premier plans offer one-to-one coaching, 24 x 7 support, and expert guidance.
It is a free CRM and can be up and running in a few minutes. The CRM allows you to import all your contacts as CSV. It matches the existing fields with the standard, existing HubSpot properties such as lifecycle stage, renewal date, deal won date, etc.
Salesforce offers content in the form of its e-learning hub called Trailhead. But HubSpot is way ahead of Salesforce in terms of free content resources and has its own, comprehensive HubSpot Academy.
The HubSpot Academy guides you on acquiring skills and certifications on HubSpot. Salesforce offers a range of powerful certifications as you thrive for different roles.
As a paid client for HubSpot you have 24 X 7 support over the phone and support ticket for email responses. It offers live chat services too.
#8) Integrations
Most of the modern businesses are using integrations as a means to avoid scattered day and loss in productivity. Salesforce has a clear advantage so far as integration is concerned. It enables companies with access to Developers to build their own integrations – with open API.
Salesforce integrates with other tools to run your business better. Salesforce Ecosystem has a highly advanced environment for products and integrations termed as App Exchange. It offers internationally supported integrations with SAP, Google Cloud, Intuit Quick books, Mail Chimp, Zen Desk, and many more applications.
It connects with other on-premises legacy systems and SaaS platforms. It has also recently acquired MuleSoft.
HubSpot has an integration library with 270 out-of-the-box integrations that are simple to set up. It integrates with apps like Slack, Jira and Mail Chimp.
Conclusion
We have found that both the CRMs have their own advantages and disadvantages. Before deciding on any one of the CRMs, you must be absolutely clear on what all are the needs of the organization. Salesforce has an average customer satisfaction score of 4.4/5 and HubSpot has 4.5/5.
If your organization has a budget constraint then it is better to choose HubSpot, with its lightweight framework – considering a whole lot of features offered by this free CRM as well as integrations. HubSpot is more for the small businesses that want to scale at a later stage.
However, if your organization has a larger community to serve and enhanced functionalities, then Salesforce is the right choice within the constraints of needs, structure, and goals. Many organizations opt for both CRMs serving different and complementary purposes.